Waterfall Chart
分数:
4.3 / 5
Data Visualization
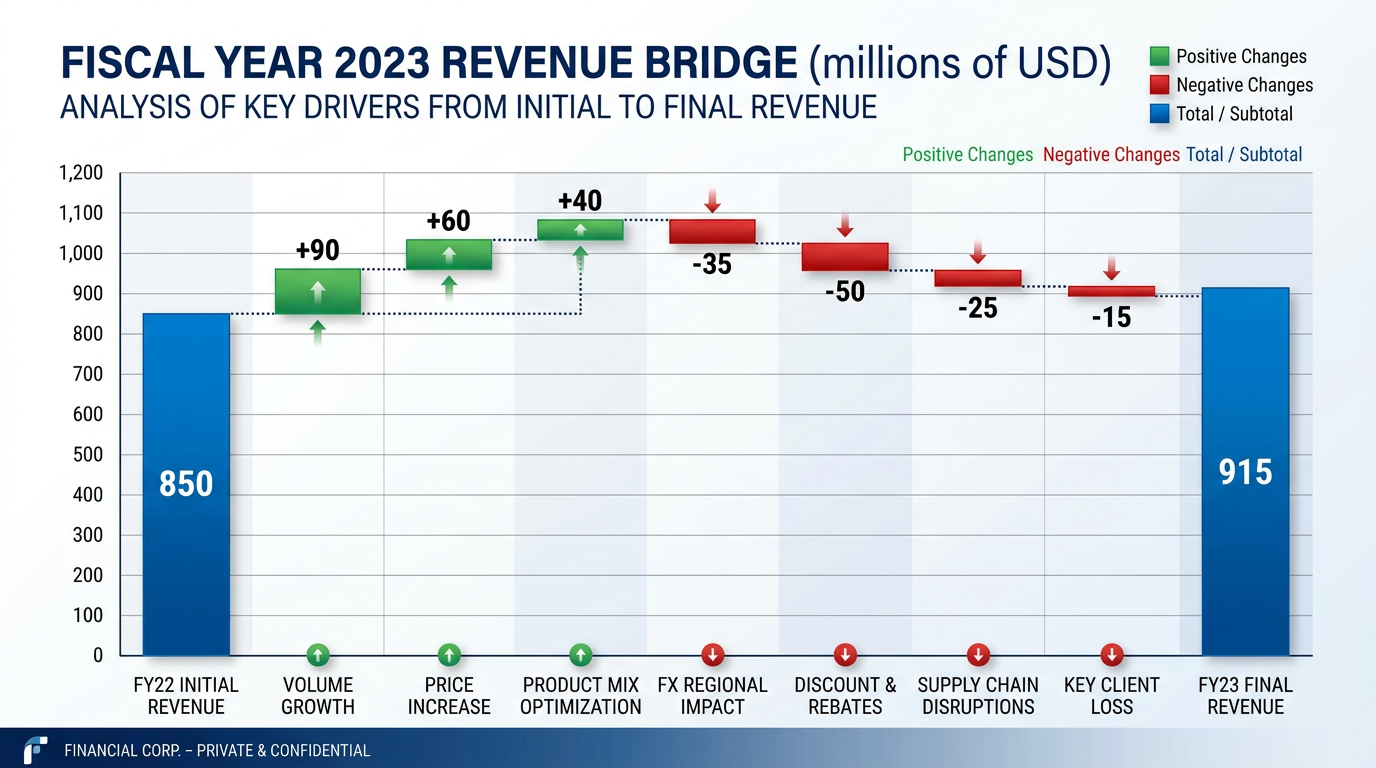
描述
For data analysts, researchers, and BI specialists who want to visualize data and create charts, this nano banana prompt makes AI image generation a breeze.
纳米香蕉🍌
Create a professional waterfall chart for showing how initial value reaches final value through positive and negative changes. Chart: horizontal bars showing step-by-step changes from starting point to ending point. Positive changes in green (or blue), negative changes in red (or orange), floating between levels. Include connector lines or dotted lines showing the flow. Labels: value and description for each change. Title: clear description of what the waterfall shows. Design: financial analysis style, clear step progression, executive presentation quality. Use for revenue bridge, cost breakdown, P&L analysis. 16:9 format.
尖端
Use 'color-coded changes' (green positive, red negative) | Include 'connector lines' showing flow | Request 'clear value labels' on each bar | Specify 'floating bars' between levels