Annual Report Data Visualization
Score:
4.4 / 5
Data Visualization
Describtion
Want to visualize data and create charts? With this nano banana prompt, data analysts, researchers, and BI specialists can create AI images that look professional.
Prompt for nano banana 🍌
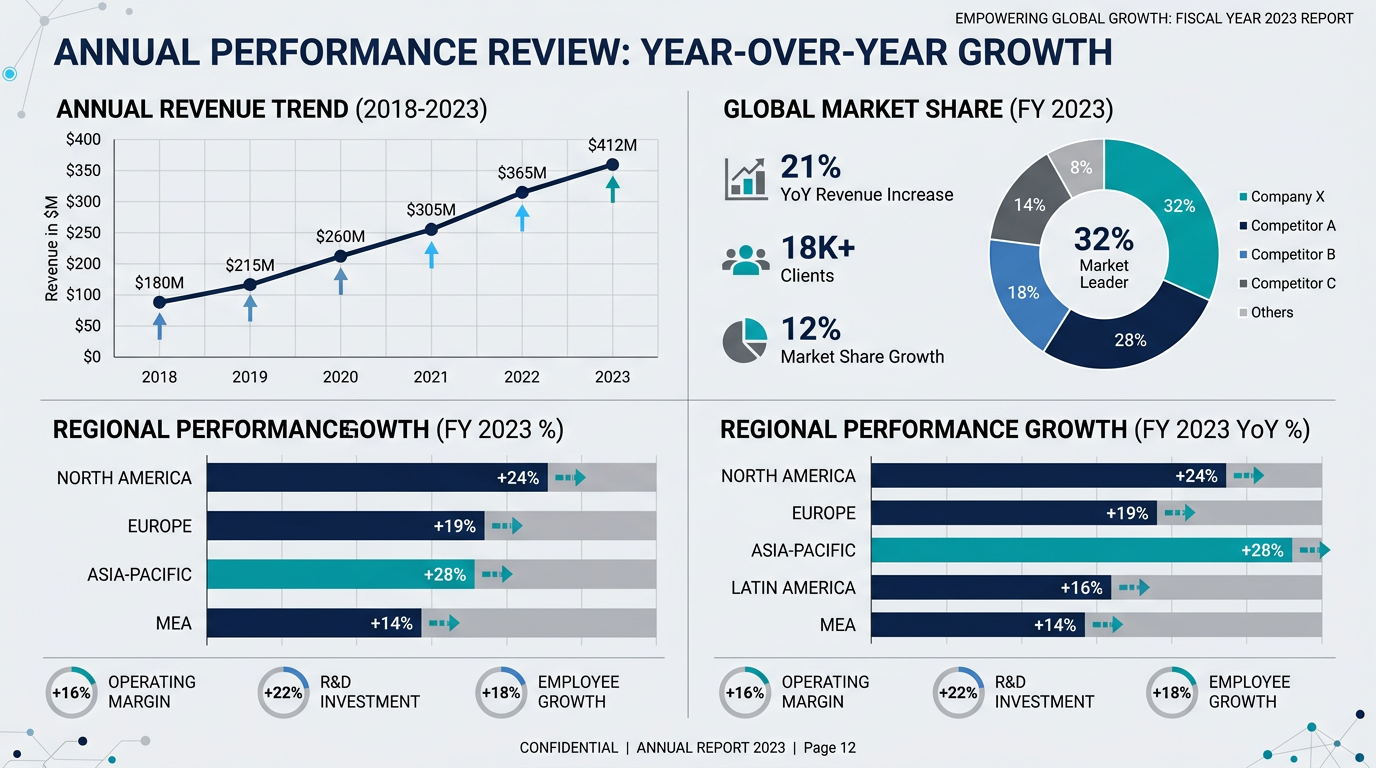
Create a professional data visualization for an annual report. Main element: multi-panel infographic showing year-over-year growth. Include: line graph for revenue trend, pie chart for market share, bar chart for regional performance, key stats callout boxes. Design: consistent corporate color palette (navy, teal, gray), clean grid lines, clear legends and labels. Text must be crisp and professional. Layout: balanced composition with clear visual flow. 16:9 format.
Tips
Use 'clean, modern style' for professional look | Specify 'clear text rendering' for readability | Mention color scheme for brand consistency | Request 'ample white space' to avoid clutter