Box Plot
Score:
4.8 / 5
Data Visualization
Describtion
You can use this prompt in nano banana to generate AI images for visualizing data and create charts. Perfect for data analysts, researchers, and BI specialists who need quick, professional visuals.
Prompt for nano banana 🍌
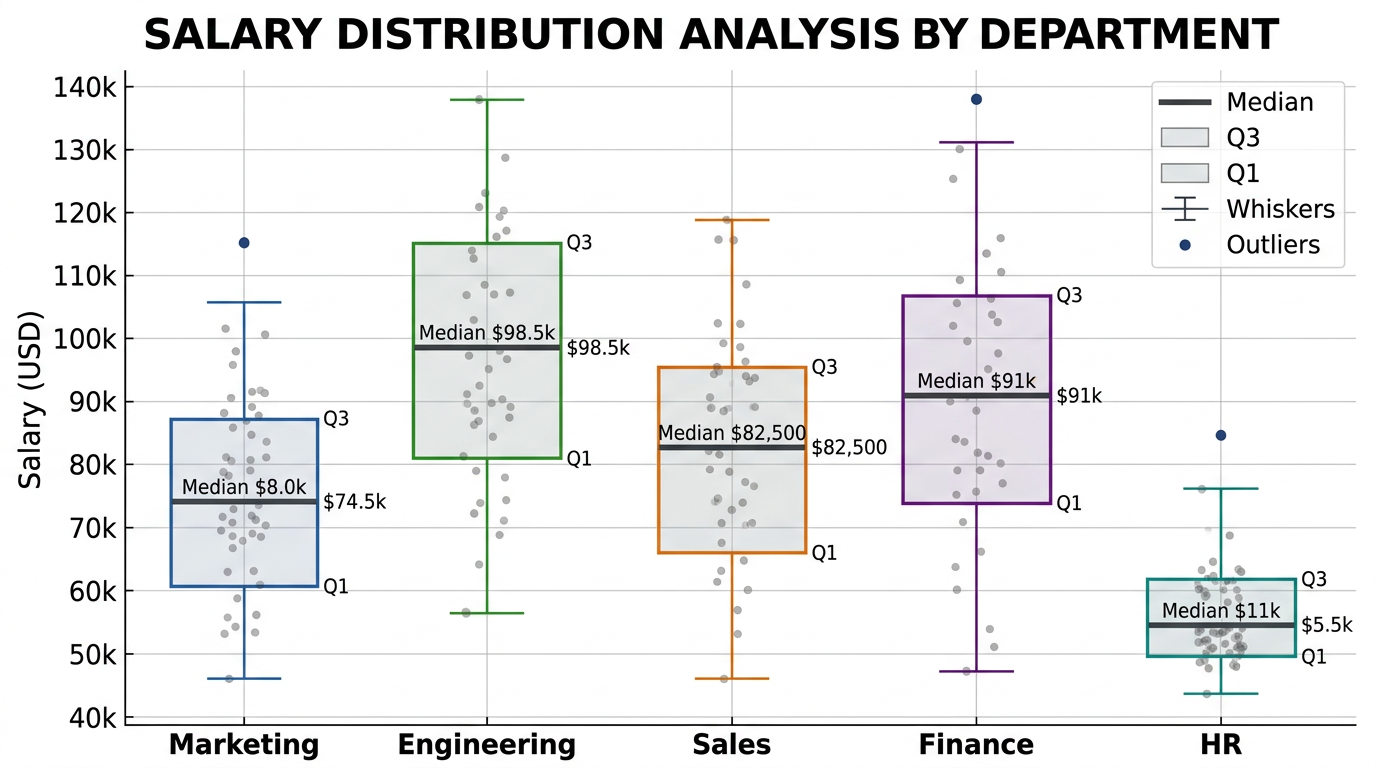
Create a professional box plot (box-and-whisker plot) for showing statistical distributions. Chart: boxes showing quartiles (Q1, median, Q3), whiskers showing min/max and outliers as individual points. Multiple box plots for comparison across categories or time periods. Include data points overlaid or alongside for detail. Labels: category names below each box. Legend: explaining box components (quartiles, median, outliers). Title: distribution analysis being shown. Design: statistical analysis style, clear quartile visualization, scientific/business chart. Use for salary ranges, performance scores, survey results. 16:9 horizontal format.
Tips
Use 'clear quartile boxes' with median line | Include 'outlier points' beyond whiskers | Request 'category labels' for comparison | Specify 'legend explaining components'