Annual Report Data Visualization
分数:
4.4 / 5
Data Visualization
描述
Want to visualize data and create charts? With this nano banana prompt, data analysts, researchers, and BI specialists can create AI images that look professional.
纳米香蕉🍌
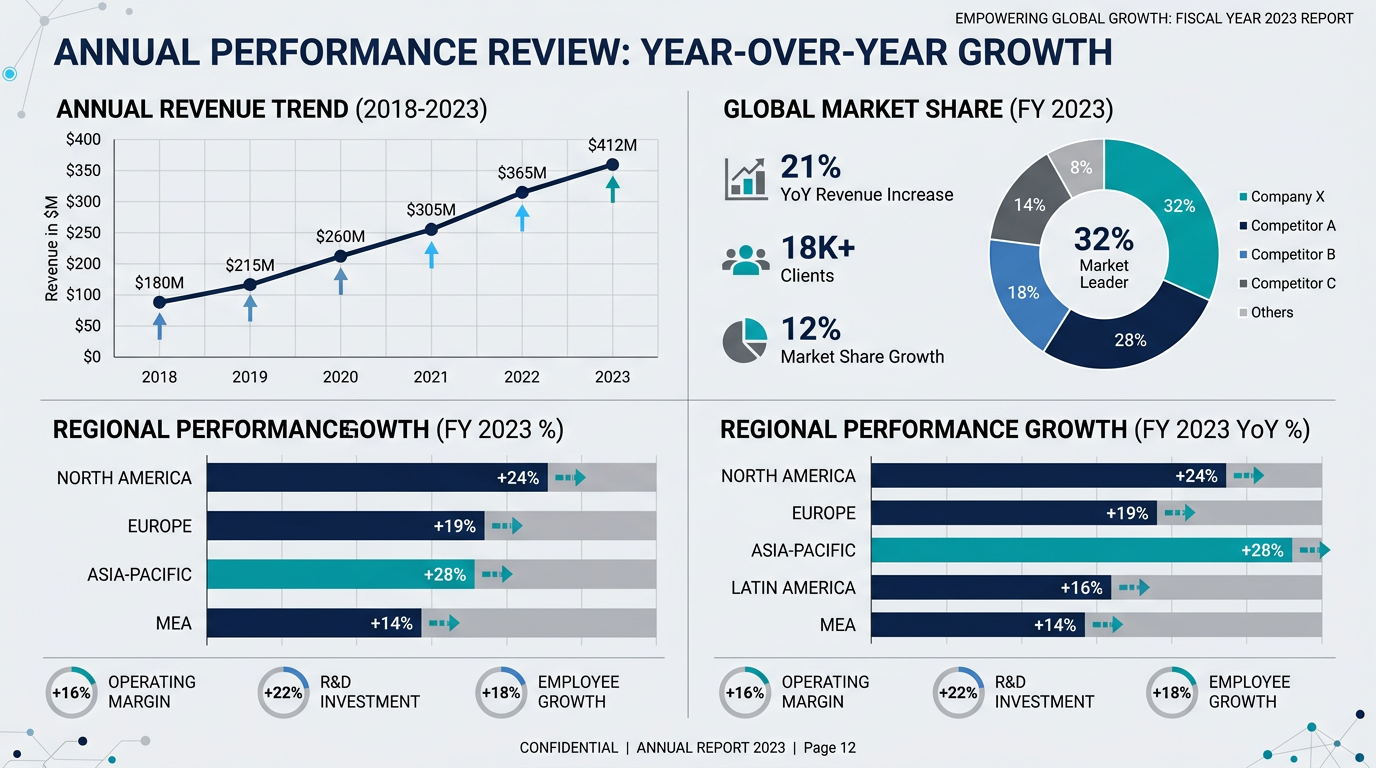
Create a professional data visualization for an annual report. Main element: multi-panel infographic showing year-over-year growth. Include: line graph for revenue trend, pie chart for market share, bar chart for regional performance, key stats callout boxes. Design: consistent corporate color palette (navy, teal, gray), clean grid lines, clear legends and labels. Text must be crisp and professional. Layout: balanced composition with clear visual flow. 16:9 format.
尖端
Use 'clean, modern style' for professional look | Specify 'clear text rendering' for readability | Mention color scheme for brand consistency | Request 'ample white space' to avoid clutter