Nano Banana 2.1: What Google's Image Benchmarks Reveal


Google released Nano Banana 2.1 on October 6, 2026. This analysis, dated October 14, treats it as a follow-up to that release—not as a new launch today.
The published results make a credible case that Nano Banana 2.1 improves on Nano Banana 2 across several image-generation and editing tasks. The largest reported advantages appear in infographic design, multi-character consistency, mask-based editing, and multi-reference work. Enabling Thinking generally produces the highest scores, although its value varies by task.
Those findings need careful boundaries. Most scores are preference-based Elo ratings, not percentages of correct images. Google supplies error ranges for Elo results but does not define their confidence level. It does not disclose sample counts, benchmark prompts, image resolutions, retry budgets, detailed Thinking settings, or equal-compute conditions in the model-card table. The factuality result comes from an automated rater rather than human accuracy measurement.
Consequently, the benchmarks are useful evidence about relative performance under Google’s evaluation, but they do not establish production reliability, latency, or return on investment. Teams considering migration still need workload-specific testing with controlled inputs, failure criteria, and complete request costs.
What Google Actually Released on October 6
Nano Banana 2.1 is Google’s updated Flash-class image-generation and conversational-editing model. The stable Gemini API model code is gemini-nano-banana-2.1. Google describes it as an update to Gemini 3.1 Flash Image, also called Nano Banana 2, and as a more efficient counterpart to Gemini 3 Pro Image, commonly called Nano Banana Pro. The Gemini API changelog records its general-availability release on October 6, 2026.
According to the Nano Banana 2.1 model card, the model is based on Gemini 3.6 Flash and accepts text and images while returning images and text. Google positions it for controlled image creation, editing, text-heavy graphics, localized rendering, and iterative workflows. Its evaluation combines side-by-side human preference judgments for generation and editing with a single-sided automated factuality assessment.
The card also identifies concrete limitations: small or lengthy text may blur or break down; identity can drift; masked edits can retain ink or follow instructions only partially; poses can persist unexpectedly; spatial relations such as left and right can be confused; and world knowledge, 3D reasoning, and factuality remain imperfect. Occasional slowness and timeouts are also acknowledged. These are operational risks, not footnotes: each needs an acceptance test and a fallback policy before deployment.
Google’s API model documentation adds implementation details. Output defaults to 1K and can be requested at up to 4K. Thinking offers minimal, medium—the default—and high. The model supports search grounding but not function calling, code execution, or structured outputs.
The model card lists context up to one million tokens and text output up to 64K, while the deployed Gemini API page lists 131,072 input tokens and 32,768 output tokens. The public documents do not explain the relationship between these different limits. Deployers should follow the documented limits of the specific endpoint they call, rather than assuming the larger model-card figures are available through that API.
Generation Elo Shows a Lead, Not an Accuracy Rate
Google reports two human-evaluated text-to-image comparisons: overall preference and infographic design. In both, Nano Banana 2.1 with Thinking ranks first, followed by Nano Banana 2.1 without Thinking, Nano Banana 2 Thinking, and Nano Banana Pro.
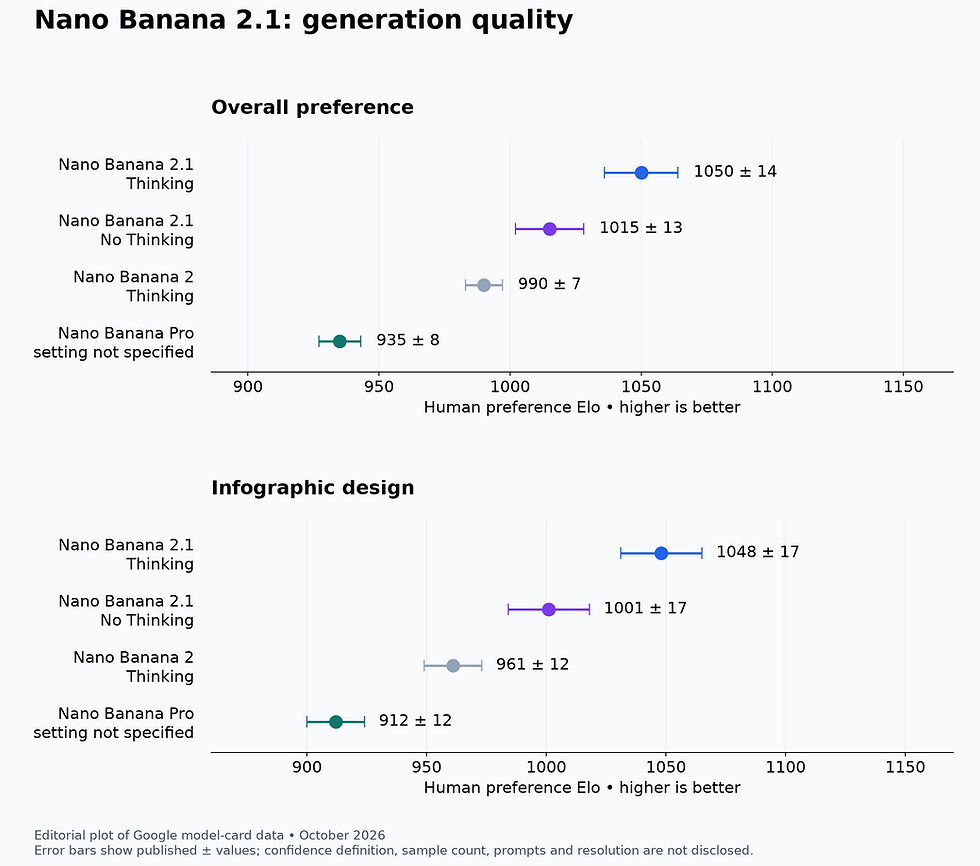
Editorial plot of numerical data published in Google DeepMind’s Nano Banana 2.1 model card, October 2026. Higher Elo indicates stronger relative human preference in Google’s comparisons; the error bars show the published ± ranges, whose confidence definition is not stated. This is not an original Google image, and Elo is not percentage accuracy.
For overall preference, Nano Banana 2.1 Thinking scores 1050 ±14, compared with 1015 ±13 without Thinking, 990 ±7 for Nano Banana 2 Thinking, and 935 ±8 for Pro. For infographic design, the corresponding results are 1048 ±17, 1001 ±17, 961 ±12, and 912 ±12.
The ordering is consistent, and several gaps are wider than the displayed ranges. In particular, both Nano Banana 2.1 modes sit above Nano Banana 2 in infographic design even after considering their published intervals. That is meaningful evidence of a preference advantage within this evaluation. It is not proof that 2.1 will win every prompt, produce a correct infographic, or need fewer retries in production.
Thinking appears beneficial here. Its 35-point overall-preference lead over No Thinking has non-overlapping displayed intervals: 1036–1064 versus 1002–1028. The infographic-design intervals touch at 1031, so the chart supports an advantage but not a precise universal effect size. Google also labels the benchmark configuration only as “Thinking.” It does not reveal whether the run used minimal, medium, high, an adaptive policy, or another internal setting.
That omission limits cost and latency conclusions. A higher Thinking score cannot be translated into “always enable high Thinking” without measuring how each available setting affects a specific workflow. The benchmark table contains no latency measurements, and this analysis should not supply invented ones.
The practical signal is narrower: teams whose users judge composition, visual polish, or infographic layout should include Nano Banana 2.1 Thinking as a serious candidate. Teams generating low-risk decorative assets may find No Thinking sufficient, but that decision belongs to a controlled test using their own prompts and acceptance thresholds.
Consistency Improves, but the Single-Character Result Is Close
Consistency is often more valuable than raw attractiveness in recurring characters, campaign variants, storyboards, product explainers, and multi-turn editing. Google separates single-character and multi-character consistency, and those two results tell different stories.

Editorial plot of Google DeepMind’s October 2026 model-card data for single- and multi-character consistency. Higher Elo means greater relative human preference; published ± ranges are shown without a stated confidence definition. The near-overlap between Nano Banana 2.1 Thinking and No Thinking for single-character consistency is important. This is not an original Google image.
On single-character consistency, Nano Banana 2.1 Thinking reaches 1028 ±14 and No Thinking reaches 1021 ±14. Their displayed intervals overlap substantially, from 1014 to 1035. It would therefore be unjustified to present the seven-point difference as an established practical advantage. Both 2.1 configurations score above Nano Banana 2 Thinking at 981 ±10 and Pro at 991 ±9, but the benchmark does not show whether failures involved faces, clothing, body proportions, accessories, or style drift.
The multi-character result is more differentiated. Thinking scores 1106 ±14, No Thinking 1068 ±14, Pro 1011 ±10, and Nano Banana 2 Thinking 978 ±10. The 2.1 Thinking and No Thinking intervals do not overlap. This suggests that additional reasoning may be more useful when a scene requires the system to track several identities and their relationships.
Even so, “supports up to four characters” is not the same as “preserves four identities reliably.” The API documentation says multi-image fusion accepts up to 14 reference images, including up to four characters and ten objects. Those are input limits, not fidelity guarantees. They do not reveal how performance changes as references become visually similar, contradictory, cropped, low-resolution, or unevenly lit.
A production evaluation should score each subject separately. Useful failure labels include face drift, wardrobe transfer, attribute leakage between characters, missing subjects, unintended duplication, changed age, and inconsistent relative height. A single overall preference vote can hide a severe identity defect if the rest of the image looks attractive.
For a one-character workflow, the chart provides little evidence that Thinking is necessary on every request. For scenes with several recurring people, its larger reported lead makes it more promising—but still subject to measured cost, latency, and identity-failure rates.
Editing Results Favor 2.1, with Different Risks by Task
Editing benchmarks are particularly relevant because a plausible-looking output can still be unusable if it changes protected regions, loses product details, or blends references incorrectly. Google reports Elo scores for general editing, consistency, mask or ink-based editing, product consistency, stylization, and multi-reference editing.

Editorial plot of verified numerical results from Google DeepMind’s Nano Banana 2.1 model card, October 2026. Higher Elo indicates stronger relative human preference for mask/ink, product-consistency, and multi-reference editing; published ± ranges are displayed, with no stated confidence definition. This is not an original Google image and does not measure exact edit compliance.
Mask or ink-based editing is the clearest example of a shared 2.1 advantage without a demonstrated Thinking advantage. Thinking scores 1049 ±15 and No Thinking 1042 ±16; their intervals overlap heavily. Both stand above Nano Banana 2 Thinking at 965 ±12 and Pro at 927 ±12. If mask editing dominates a workload, No Thinking may deserve equal attention during testing instead of being treated as an inherently inferior mode.
However, Google’s own limitations qualify the result. The model may follow masked-edit instructions only partially, preserve doodle or ink marks, or retain the source subject’s pose. Preference Elo cannot establish that pixels outside the permitted area remained unchanged. For catalog and regulated workflows, a separate preservation metric is essential.
Product consistency shows a less decisive comparison between 2.1 No Thinking and the older models. The scores are 1024 ±18 with Thinking, 981 ±18 without it, 955 ±22 for Nano Banana 2 Thinking, and 965 ±14 for Pro. No Thinking’s interval overlaps those of both older models. The published chart therefore supports Thinking as the strongest configuration in this evaluation, but it does not support claiming that every 2.1 configuration clearly improves product fidelity.
Multi-reference editing tells a stronger 2.1 story: 1066 ±22 with Thinking and 1041 ±20 without it, versus 988 ±13 for Nano Banana 2 Thinking and 989 ±12 for Pro. Yet the two 2.1 intervals overlap, so the 25-point gap between their central scores should not be exaggerated.
These tasks also require different acceptance rules. A creative composite may tolerate minor geometry changes, while an ecommerce image may fail if a logo, port, button, material, or package quantity changes. Migration decisions should therefore be made per edit class, not from a blended “editing is better” conclusion.
Factuality Is Promising but Remains the Weakest Claim
Google reports infographic factuality scores of 0.521 for Nano Banana 2.1 Thinking, 0.328 without Thinking, 0.265 for Nano Banana Pro, and 0.179 for Nano Banana 2 Thinking.

Editorial plot of October 2026 AutoRater factuality data from Google DeepMind’s Nano Banana 2.1 model card. Higher is better, but this single-sided automated-rater score is not a human accuracy percentage. Google publishes no uncertainty ranges here. This is not an original Google image.
The result supports a limited conclusion: under Google’s automated assessment, Thinking substantially improves Nano Banana 2.1’s factuality score, and the resulting score exceeds those of the listed comparators. It does not mean that 52.1% of infographics are factually correct. The model card does not define the score as a percentage, publish its uncertainty, disclose the prompt count, or provide enough detail here to calculate error rates.
That distinction matters because factual graphics have multiple failure surfaces. A chart can contain correct prose but plot the wrong values. It can cite a real source while mismatching dates. A map can swap regions; a timeline can reverse events; a label can be assigned to the wrong object. Automated scoring may capture some of these errors, but the table does not disclose its coverage in sufficient detail to treat it as a release gate.
Search grounding can supply newer information, but retrieval does not guarantee faithful visual transcription. The model card also describes a March 2026 knowledge cutoff for Gemini 3.6 Flash, with some domains potentially limited to January 2025 and some receiving newer information. For time-sensitive graphics, source material should be explicitly supplied or retrieved, then checked against the rendered image.
A defensible workflow separates source truth from presentation. Maintain an approved fact sheet containing values, units, dates, labels, and citations; generate the visual from that brief; then compare every rendered claim with the approved facts. This is also where maintaining traceable source facts and briefs for visual content helps keep review grounded in the underlying evidence rather than the image’s apparent confidence.
The benchmark makes Thinking the obvious factuality candidate, not an autonomous publishing system. Human or deterministic verification remains necessary for medical, financial, legal, historical, scientific, and current-events graphics.
Output Is Cheaper at Every Resolution, but Requests May Not Be
At Standard paid API rates, Google lists Nano Banana 2.1 image output at $30 per million output image tokens. Nano Banana 2 costs $60 per million. That headline looks like a universal 50% reduction, but different token allocations at 4K and higher non-image rates complicate the total.

Editorial calculation from Google’s Gemini API pricing, October 2026. Lower image-output-only cost is better: Nano Banana 2.1 is 50% lower at 1K and 2K and 25% lower at 4K. Costs exclude input, text or Thinking output, grounding, retries, taxes, and possible Batch discounts. This is not an original Google image.
The transparent calculation is rate multiplied by output image tokens:
At 1K, 1,120 image tokens cost $0.0336 for Nano Banana 2.1 and $0.0672 for Nano Banana 2. At 2K, 1,680 tokens cost $0.0504 and $0.1008 respectively. At 4K, the models use different token allocations: 3,780 × $30 per million gives $0.1134 for 2.1, while 2,520 × $60 per million gives $0.1512 for Nano Banana 2.
Thus “half price” is accurate only for image-output tokens at 1K and 2K. At 4K, Nano Banana 2.1 uses more listed image tokens, reducing the output-only saving to 25%.
Other components can move in the opposite direction. Standard input pricing for Nano Banana 2.1 is $1.50 per million text, image, or video tokens, versus $0.50 per million text or image tokens for Nano Banana 2. Text and Thinking output is $7.50 per million tokens for 2.1 versus $3 for Nano Banana 2. A complete estimate must therefore include actual input tokens, textual output, Thinking consumption, grounding charges where applicable, retries, taxes, and any Batch discount.
No “typical request” total can be responsibly calculated without assuming prompt length, reference-image tokenization, Thinking usage, resolution, and retry rate. A cheaper successful image can still come from a more expensive request, while better first-pass acceptance can offset higher reasoning charges. Measure cost per accepted asset, not merely price per generated image.
A Suggested Evaluation Plan for Migration
The following is a proposed test design, not a description of tests performed for this article.
Begin with a stratified prompt set drawn from real work. Separate text-to-image, single-character, multi-character, product editing, masked editing, multi-reference composition, text-heavy layouts, and factual graphics. Preserve prompts, reference files, aspect ratios, resolutions, and safety settings so that every model receives the same task.
Compare Nano Banana 2.1 at minimal, medium, and high Thinking with Nano Banana 2 Thinking. Include Pro only if it is a genuine deployment option; because the benchmark chart does not specify Pro’s setting, do not assume its compute or reasoning configuration matches the others. Give each condition the same retry budget in the internal test, even though Google does not disclose whether its benchmark did so.
Define acceptance rules before examining outputs:
For text rendering, transcribe every required word and record missing, substituted, blurred, or malformed text.
For identity, score each character independently and record attribute leakage, duplication, omission, and face or wardrobe drift.
For product work, compare protected features such as shape, logo, controls, count, color, material, and package text.
For masked edits, measure both requested-region success and unintended changes outside the mask.
For spatial prompts, test left/right, foreground/background, containment, ordering, and relative size.
For factual graphics, verify every number, unit, date, label, citation, and visual encoding against a locked source sheet.
For operations, record timeouts, end-to-end latency, retry count, token use, grounding charges, and cost per accepted result.
Use blinded human review for subjective quality and deterministic checks wherever exactness is possible. Report uncertainty and retain paired outcomes, since the same prompt run across models is more informative than unrelated averages. Do not collapse all tasks into one score if failures have different business consequences.
Test endpoint behavior as well as image quality. Confirm 131,072 input and 32,768 output limits against the current API documentation, verify the default 1K resolution, and exercise 2K and 4K explicitly. Test 14-reference inputs only if needed, remembering that four-character and ten-object limits do not promise preservation. Because function calling, code execution, and structured outputs are unsupported, orchestration and validation must occur outside the model.
Finally, run a shadow phase before switching production traffic. Capture rejection reasons and compare cost per accepted asset. This reveals whether benchmark gains translate into fewer revisions rather than merely better-looking first impressions.
Who Should Migrate—and Who Should Wait
Nano Banana 2.1 is the stronger candidate when a workflow depends on infographic design, multi-character scenes, multi-reference composition, mask-based edits, or lower image-output charges. Thinking deserves priority for factual graphics and complex multi-subject tasks. No Thinking remains worth testing for simpler generation and editing, especially where its published interval overlaps Thinking or where reasoning cost matters.
Migration should wait when exact small text, long passages, strict identity preservation, protected-region editing, spatial precision, or verified facts are non-negotiable and the organization lacks an external validation step. The same applies when existing automation depends on unsupported function calling, code execution, or structured output.
Documentation discrepancies should be handled conservatively: follow the chosen endpoint’s current limits and measure observed behavior rather than inferring capacity from the broader model architecture. Likewise, the current deprecations table lists Gemini 3.1 Flash Image as deprecated but announces no shutdown date. There is no verified October 29 retirement deadline to force a rushed cutover.
The decision is therefore concrete. Migrate if Nano Banana 2.1 clears task-specific fidelity thresholds, reduces cost per accepted image, and meets measured latency and timeout requirements. Use Thinking only where its acceptance-rate gain justifies its additional output cost. Keep Nano Banana 2 or another fallback until 2.1 passes shadow testing. And for factual, identity-sensitive, or precisely edited assets, require validation regardless of which model leads the benchmark.


