Create Charts in PowerPoint with AI
Learn how to create PowerPoint charts with remio. Supply data and definitions, choose a chart type and verify values and editability in the .pptx.
Describe the data and the point of the chart
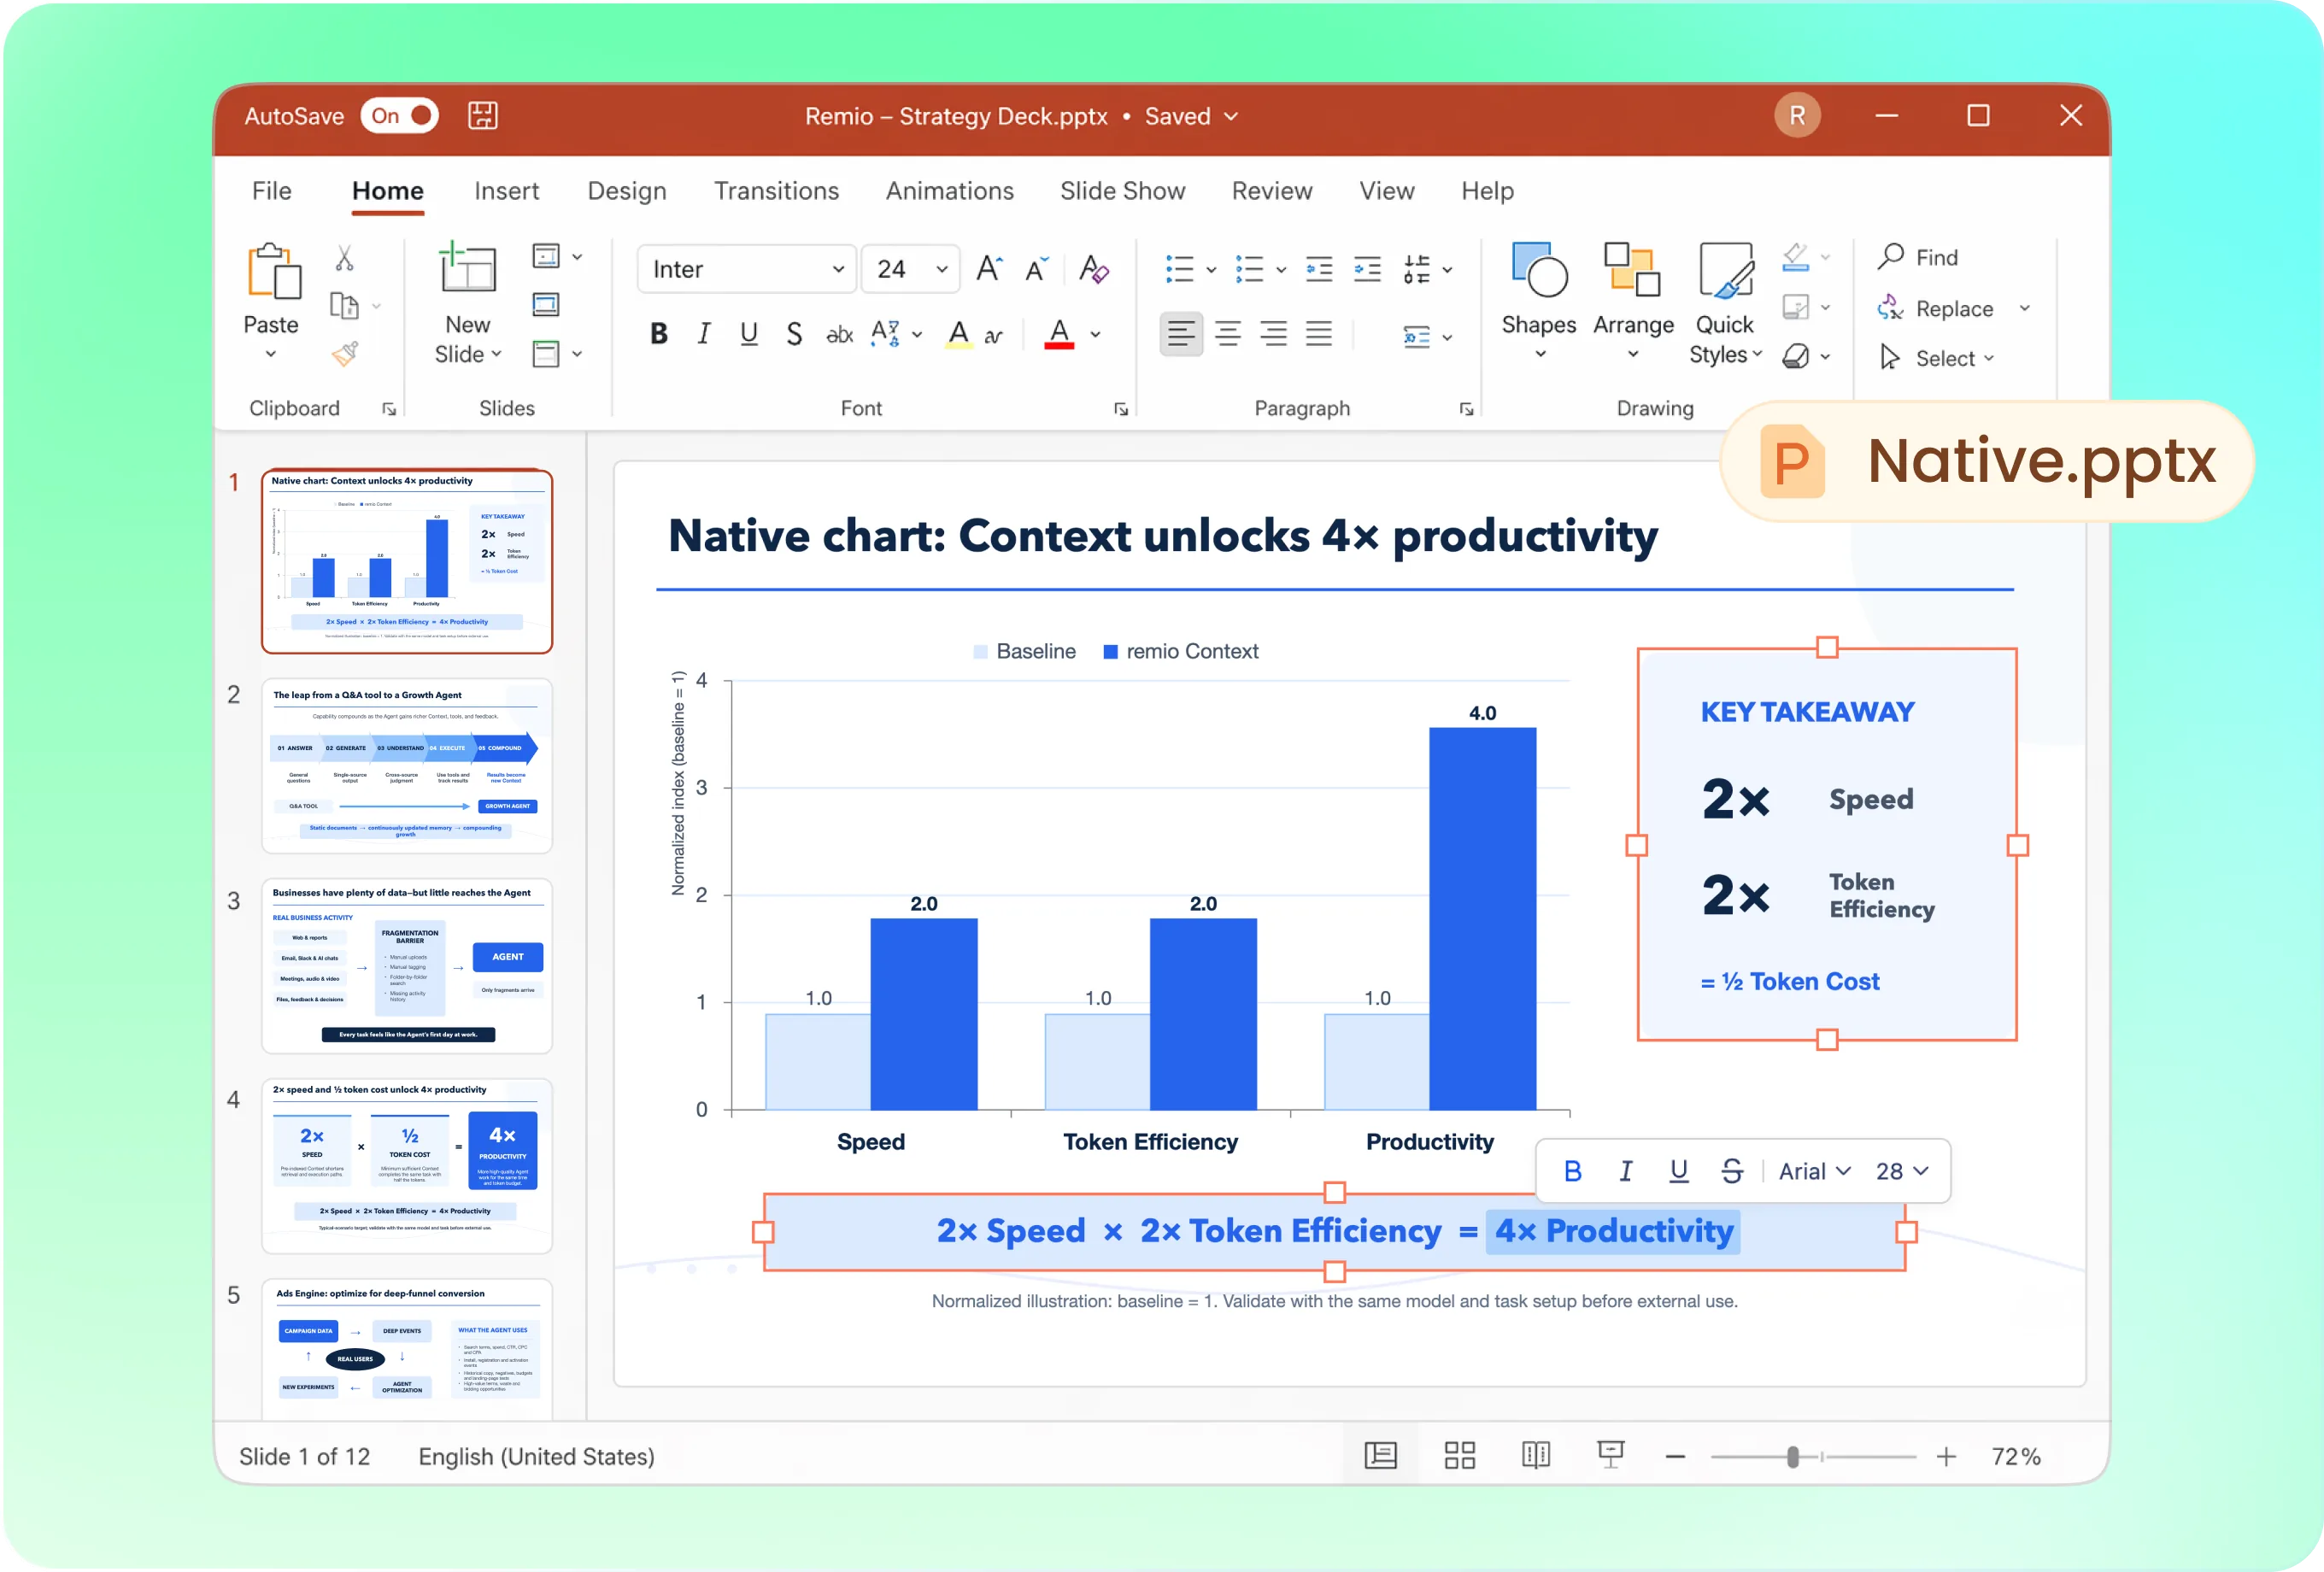
Try: “Create a PowerPoint slide comparing these three categories with a column chart. The values are fictional example minutes per item: Cause A 3, Cause B 5 and Cause C 4. Label the unit and mark the data as an example. Use a native chart where supported and keep the title editable.” For your real deck, replace the example with a verified source and a meaningful takeaway.

Choose the chart for the comparison
Use columns or bars for discrete categories and a line for an ordered trend. Explain the question before requesting a decorative format. Provide the company presentation as a style reference and use restrained colors. Check that labels, scale and units remain readable rather than relying on color alone to communicate the result.

Update the source before updating the conclusion
Use the current .pptx with the revised data and identify the affected chart. Ask remio to update the values, labels and any title that depends on the result. Check every series and category against the new source; an unchanged takeaway can become misleading even when the chart numbers are correct.

Verify values and native chart behavior
Open the .pptx in PowerPoint and inspect the chart object and its data. Check category order, units, totals and denominators. Distinguish a native chart from an image of a chart. Confirm whether the delivered file contains editable chart data or depends on an external source; do not infer this from appearance alone.

Keep data definitions with the story
Record the reporting period, population and metric definition. Keep observed results separate from targets or forecasts. For rates, check that the numerator and denominator match the same period and population. If the source is incomplete or two reports disagree, resolve that before turning the chart into a confident recommendation.
How it works
From source material to a PowerPoint file you can keep updating.
01
Add the data and definitions
Provide categories, numeric values, units, period and source.
02
Confirm the visual comparison
Choose the chart type, intended takeaway and reference style.
03
Inspect the chart in PowerPoint
Verify data, labels, calculations and native editability.
FAQs
Yes. You can download remio and start for free. Some advanced usage may depend on your subscription plan, but you can try the AI presentation workflow before committing.
Use remio’s desktop presentation workflow. In Chat, type /pptx followed by a space and describe your task with the relevant source files. This tutorial does not describe an online upload-and-convert form.
Use the data source together with metric definitions, reporting dates and the purpose of the comparison. Check totals and rate denominators. Distinguish sample data, observed results, forecasts and targets before presenting a conclusion.
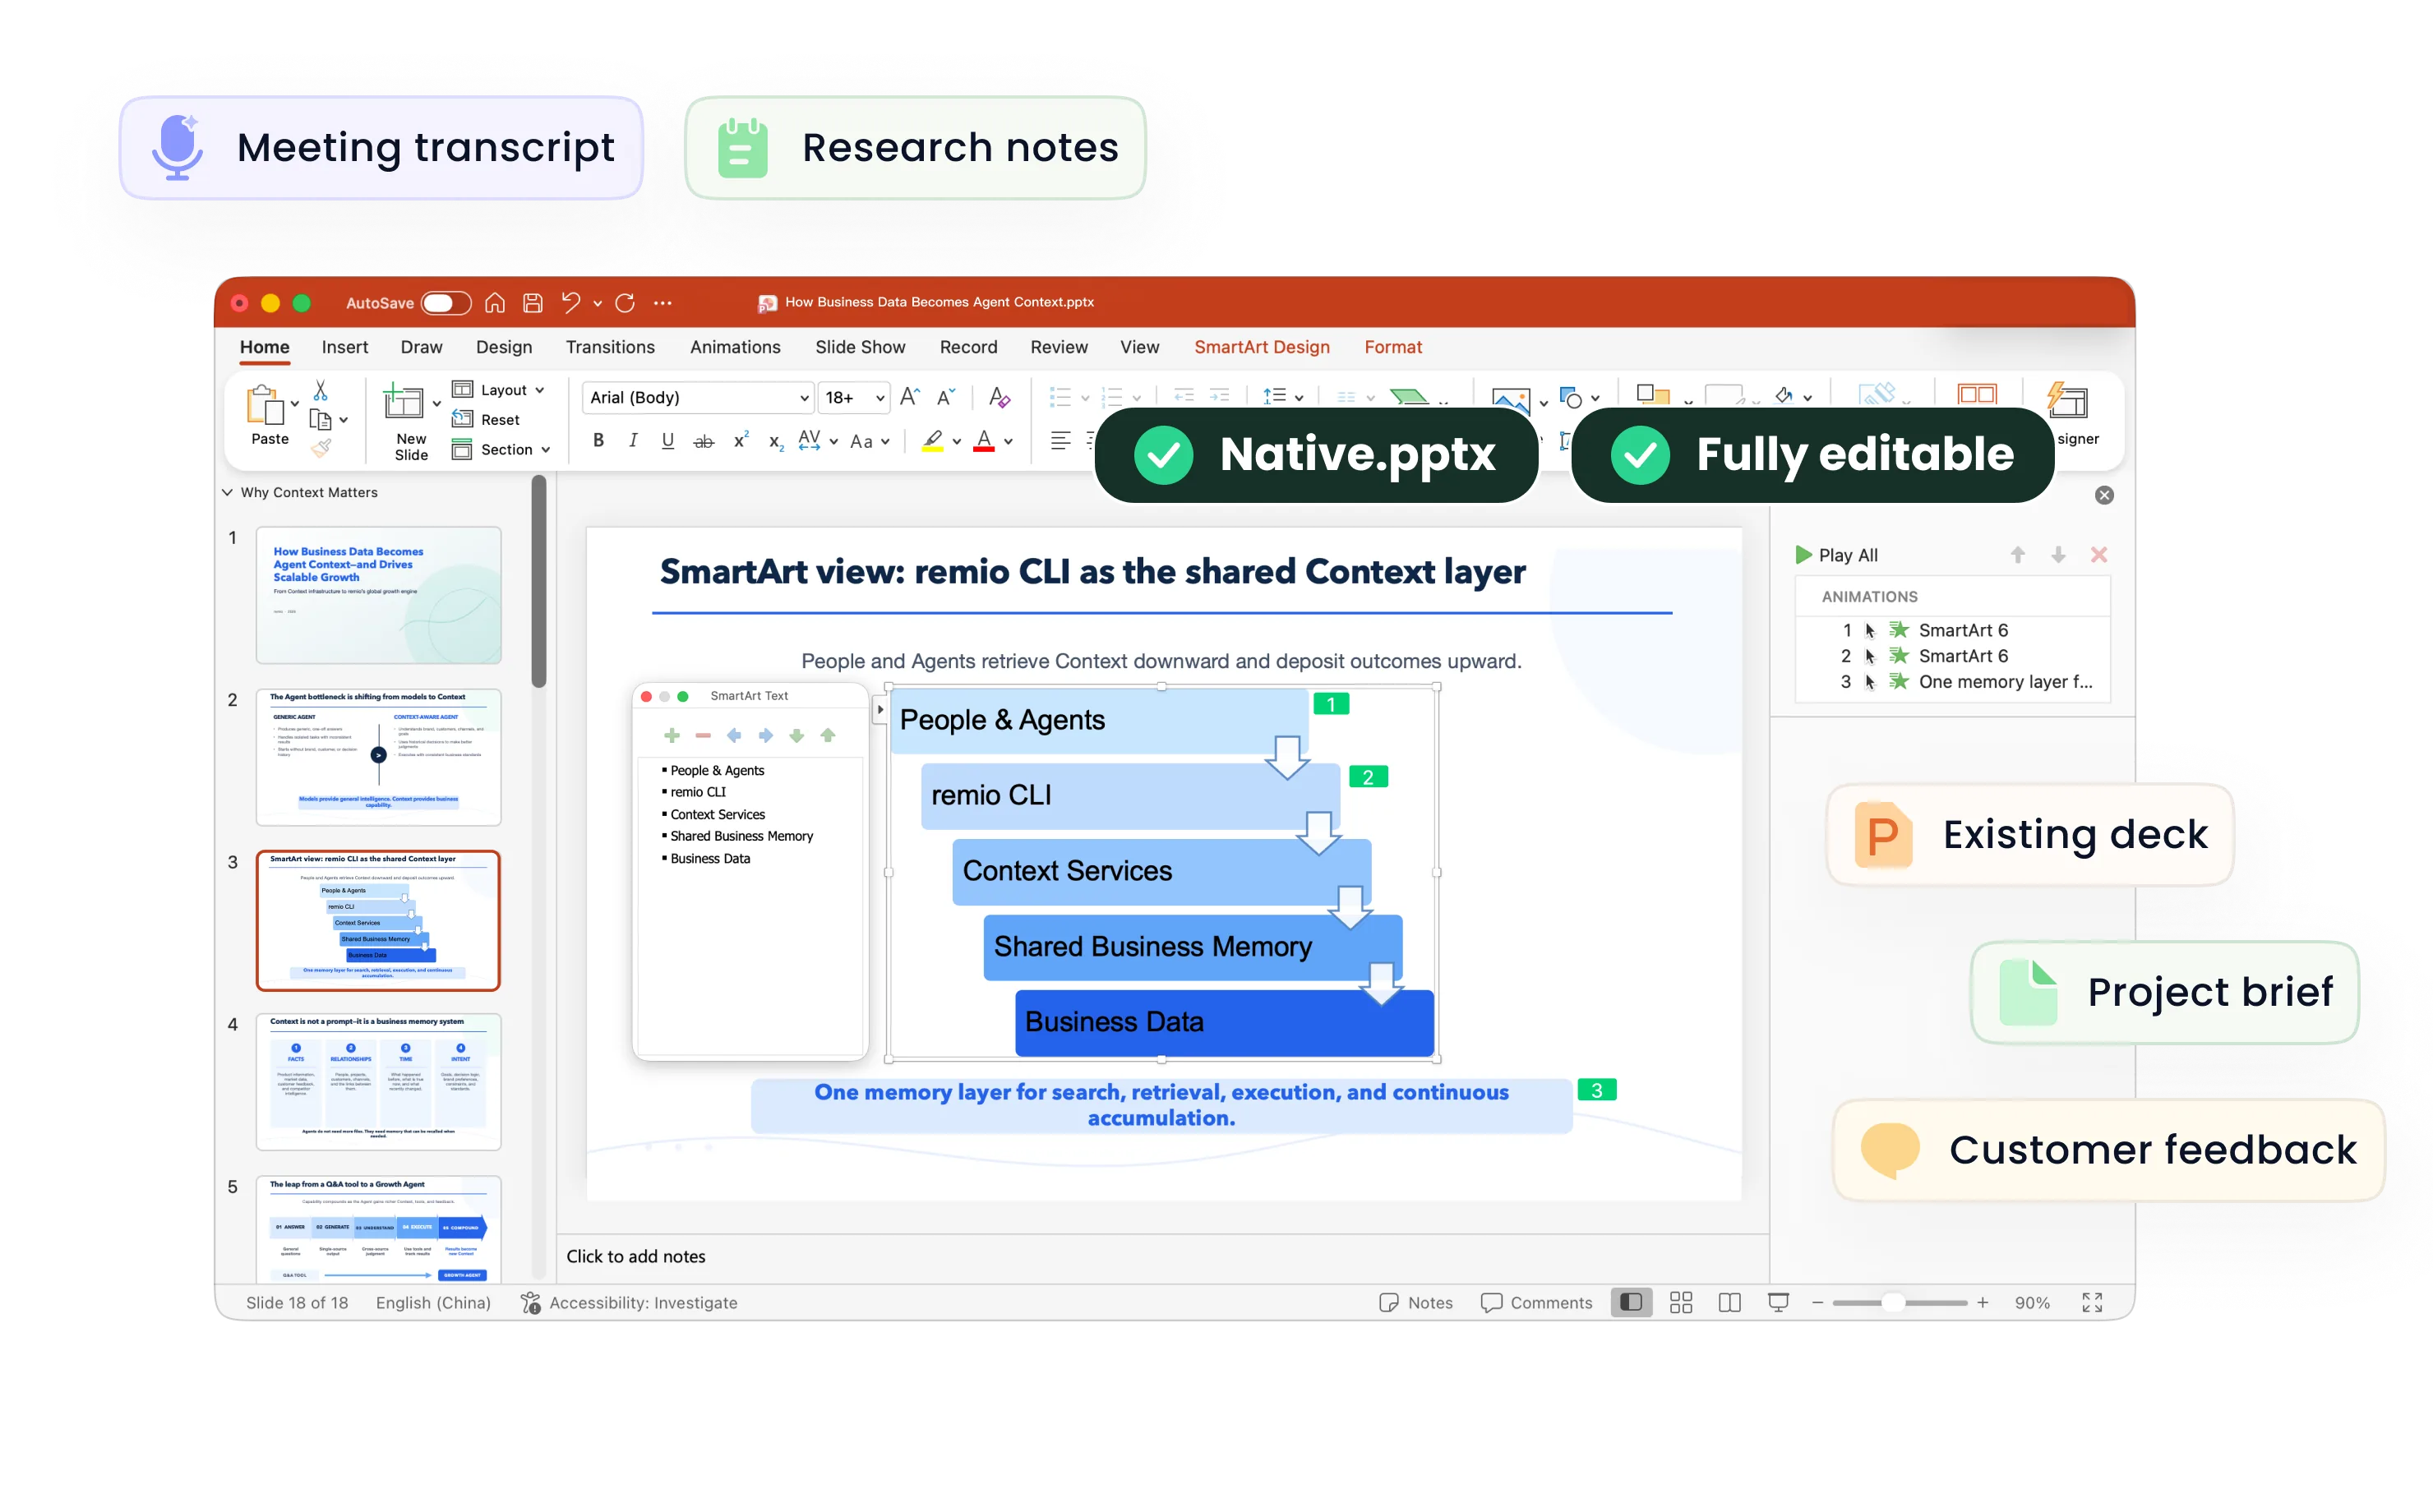
The output is a native .pptx for further editing in PowerPoint. Inspect the text, shapes and charts in the actual file. Text within a source image and image-based slide content do not become independent native objects merely because the file is a .pptx.
This tutorial focuses on native PowerPoint files. You can separately check whether another presentation application can import your .pptx, but import compatibility does not mean remio directly edits a Google Slides or Canva project. Review fonts, charts and other complex content after conversion.