Business Metrics Dashboard
Score:
4.9 / 5
Business Infographic
Describtion
No more struggling with creating infographics and data visualizations - this nano banana prompt helps business folks, marketers, and analysts generate AI images effortlessly. Super efficient for visual tasks.
Prompt for nano banana 🍌
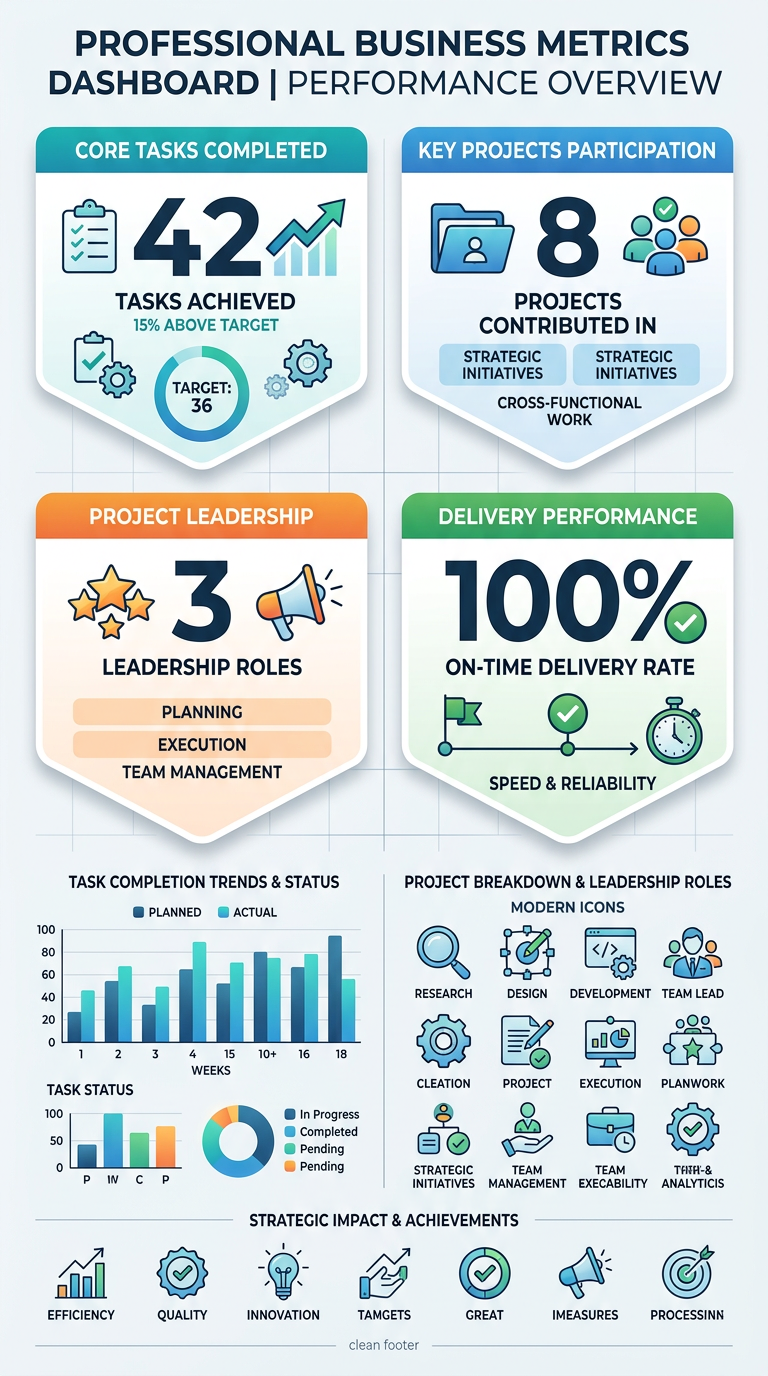
Create a professional business metrics dashboard infographic showing: Completed 42 core tasks (15% above target), participated in 8 key projects, led 3 projects, 100% on-time delivery rate. Use unified icon style, clear visual hierarchy with 4-6 main sections, prominent key metrics display. Clean modern design, minimal clutter, excellent text rendering. 9:16 vertical format.
Tips
Use 'clean, modern style' for professional look | Specify 'clear text rendering' for readability | Mention color scheme for brand consistency | Request 'ample white space' to avoid clutter