Comparison Table
Score:
4.5 / 5
Business Infographic
Describtion
Stuck on creating business infographics and data visuals? This nano banana prompt helps business folks, marketers, and analysts generate AI images in minutes. Gets the job done fast.
Prompt for nano banana 🍌
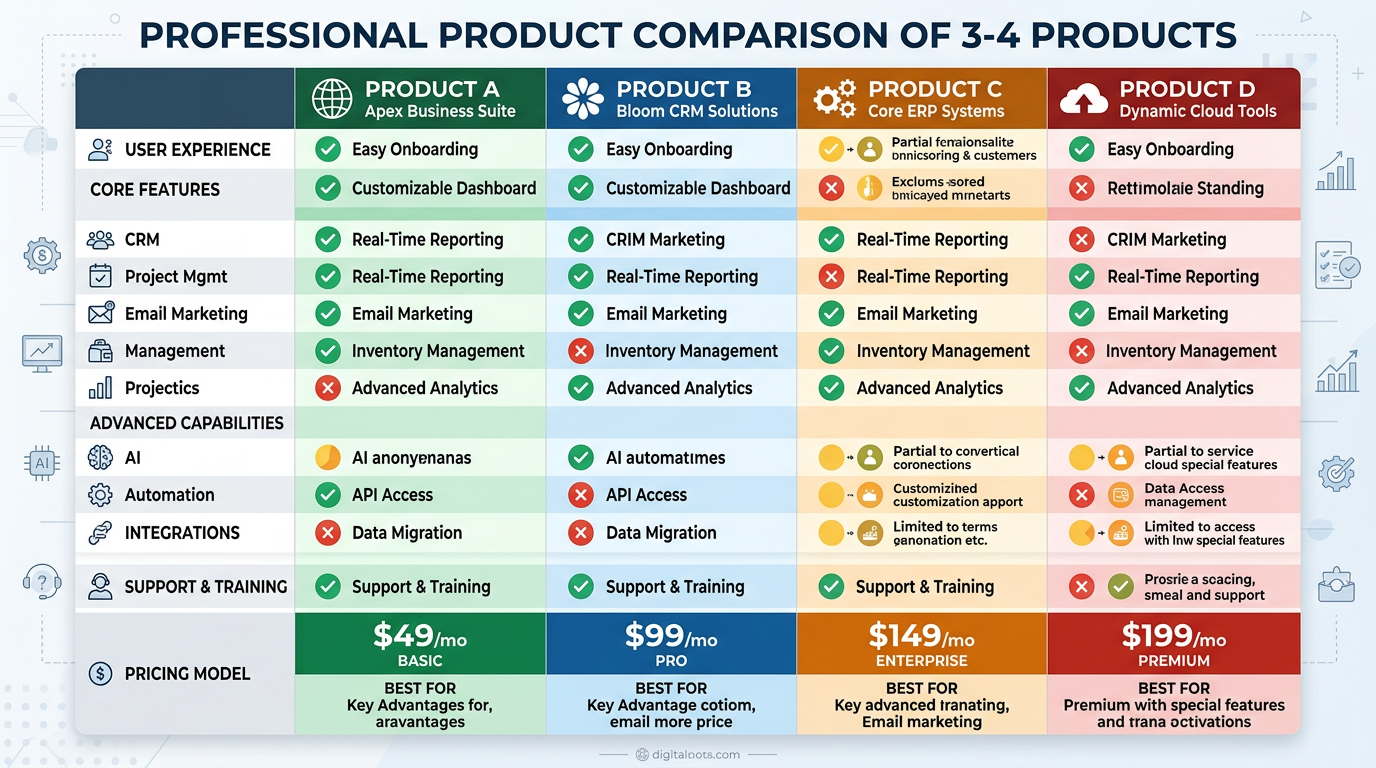
Create a professional comparison table infographic comparing 3-4 products or services. Layout: columns for each product, rows for features. Header row: product logos/names with distinct background color. Checkmark icons for included features, X for excluded, custom indicators for partial/limited features. Use color coding: green for advantages, red for disadvantages, yellow for neutral. Pricing row at bottom highlighted. Style: clean modern table design, clear visual hierarchy, professional business presentation. 16:9 format.
Tips
Use 'checkmark and X icons' for clarity | Apply color coding (green/red/yellow) | Highlight 'pricing row' with distinct background | Request 'clear column separation' for readability