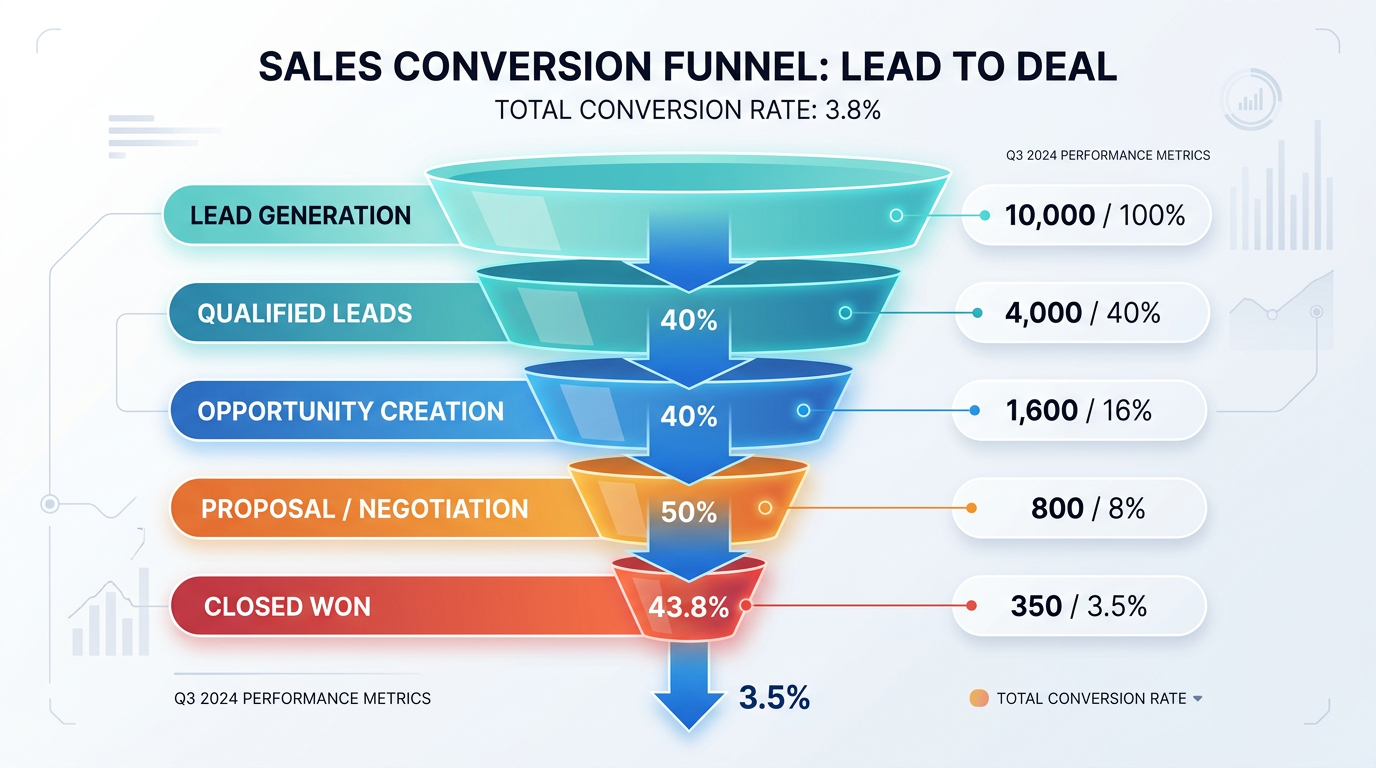
Funnel Chart
Score:
4.4 / 5
Data Visualization
Describtion
When you need to visualize data and create charts, this nano banana prompt helps data analysts, researchers, and BI specialists get it done with AI images.
Prompt for nano banana 🍌
Create a professional funnel chart for showing conversion stages or pipeline. Funnel: 4-6 stages from wide (top) to narrow (bottom), each section labeled with stage name and count/percentage. Color scheme: gradient from top to bottom or distinct professional colors for each stage. Include conversion rates between stages (arrows with percentages). Left side: stage labels. Right side: absolute numbers and percentages. Title: descriptive at top, subtitle with total conversion rate. Design: clean marketing/sales analytics, clear visual progression. Style: conversion tracking, sales pipeline, customer journey. 16:9 vertical format.
Tips
Include 'conversion rates between stages' | Use 'gradient or distinct colors' | Request 'clear stage labels' | Specify 'total conversion rate' highlight