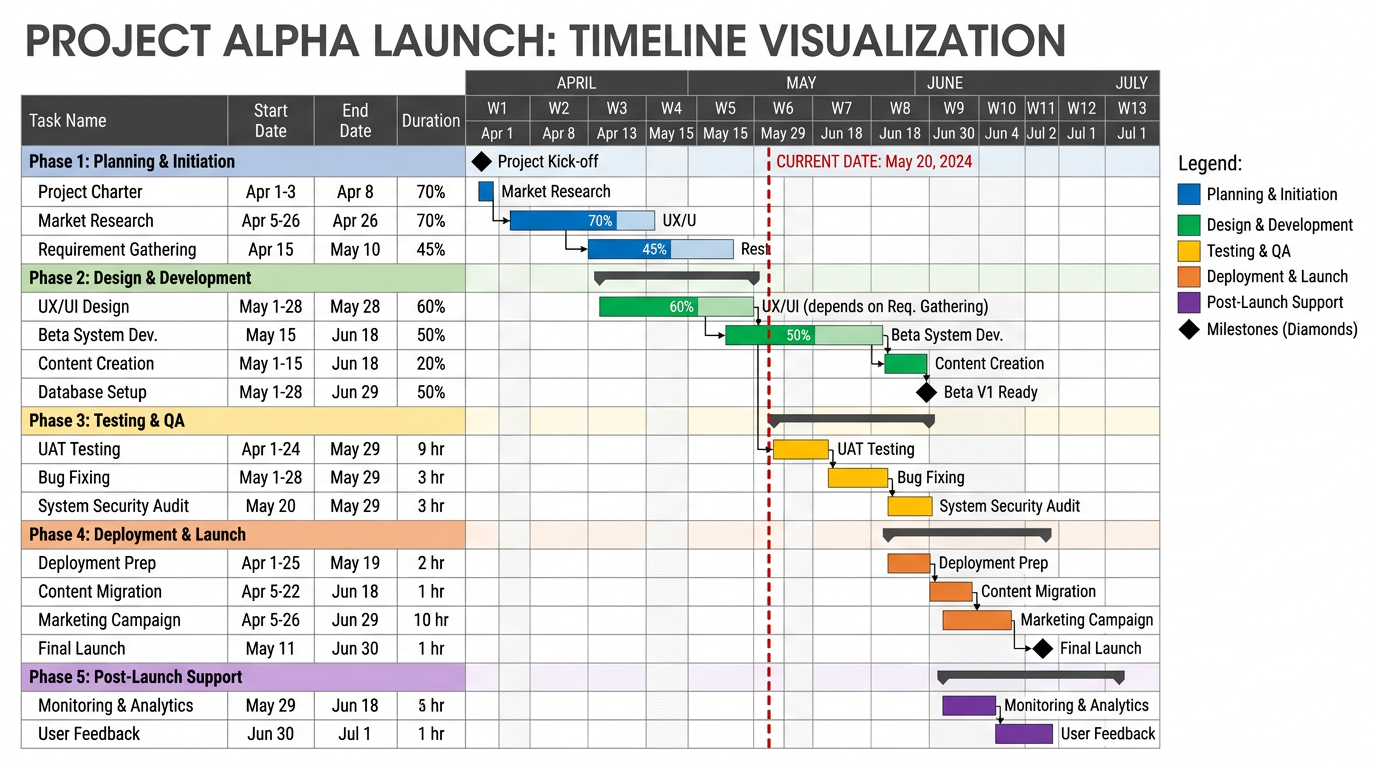
Gantt Chart
Score:
4.7 / 5
Data Visualization
Describtion
This nano banana prompt is perfect when data analysts, researchers, and BI specialists need to create infographics and data visualizations with AI-generated images. A real time-saver.
Prompt for nano banana 🍌
Create a professional Gantt chart for project timeline visualization. Chart: horizontal bars representing tasks, positioned on timeline. Left column: task names. Top axis: dates or weeks. Bars: different colors for task categories or phases, showing start date, duration, and dependencies. Include progress indicators (percentage complete on bars). Milestones: diamonds at key dates. Legend: explaining bar colors. Title: project name at top. Design: clean project management style, clear grid lines, current date indicator. Style: project planning, resource scheduling, timeline tracking. 16:9 wide format.
Tips
Include 'progress indicators' on bars | Use 'color coding' for task categories | Request 'milestone diamonds' | Specify 'current date indicator'