Timeline Milestone
Score:
4.5 / 5
Business Infographic
Describtion
A great way for business folks, marketers, and analysts to create infographics and data visualizations using nano banana's AI image generation capabilities. A real time-saver.
Prompt for nano banana 🍌
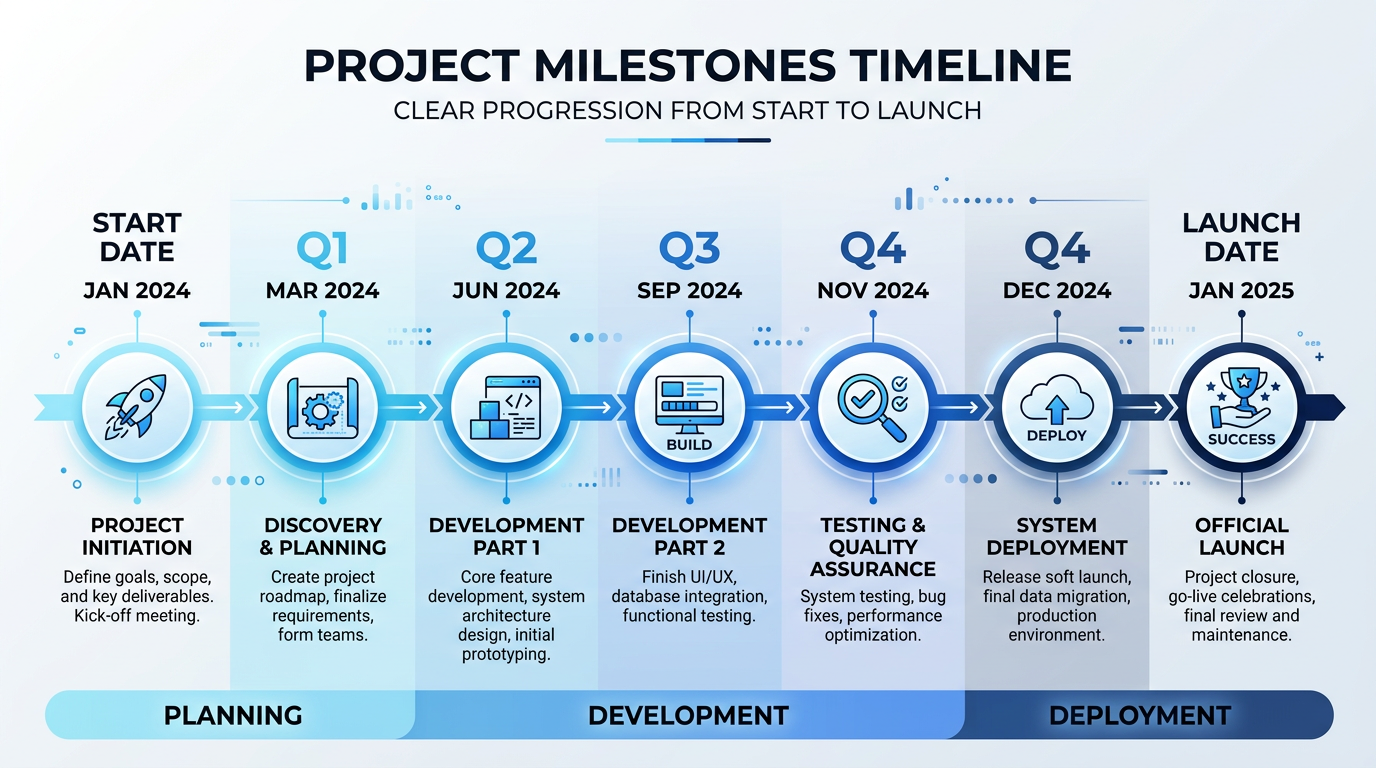
Generate a horizontal timeline infographic showing project milestones. Layout: left-to-right timeline with 6-8 key milestones. Each milestone: date on top, icon in circle, description below, connecting line to next milestone. Use progressive color scheme (start with light blue, darken to navy at end). Include project phases with subtle background shading. Milestone icons should be relevant to each phase (launch, development, testing, deployment). Style: professional project management design, clean dates, clear progression. 16:9 wide format.
Tips
Use 'progressive color scheme' to show advancement | Include 'relevant icons' for each milestone type | Request 'clean date formatting' for readability | Specify 'left-to-right flow' for natural reading