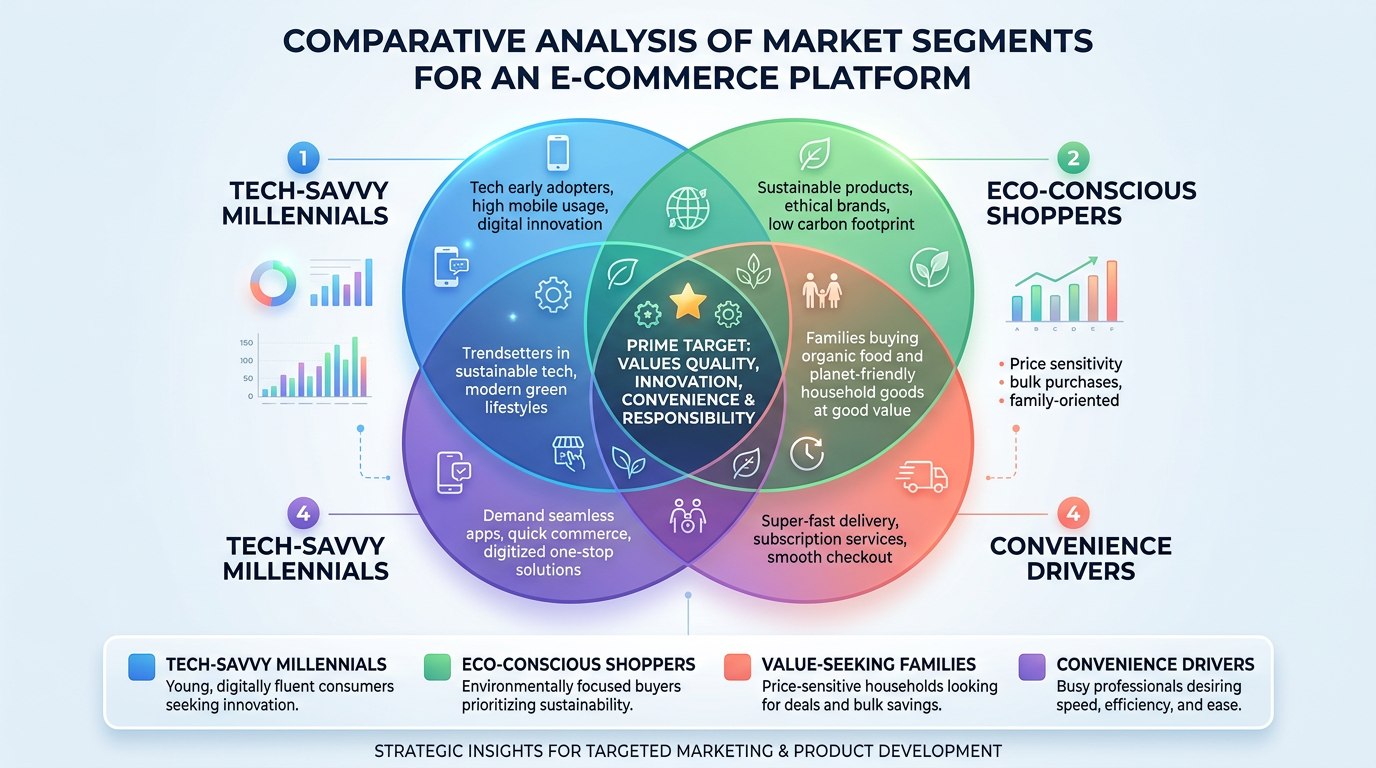
Venn Diagram
Score:
4.5 / 5
Business Infographic
Describtion
Ideal for business folks, marketers, and analysts who regularly need to create business infographics and data visuals - this nano banana prompt simplifies AI image generation.
Prompt for nano banana 🍌
Create a professional Venn diagram infographic showing relationships and overlaps between 3-4 concepts or categories. Each circle/area represents a different category with clear label. Overlapping sections labeled with shared characteristics. Color scheme: distinct semi-transparent colors for each area to show overlaps clearly. Include legend explaining each category. Title at top describing the comparison. Design: clean business infographic, professional color palette, clear visual separation. Use for comparing market segments, product features, stakeholder interests, etc. 16:9 or square format.
Tips
Use 'semi-transparent colors' for visible overlaps | Include 'legend for categories' | Request 'clear overlap labels' | Specify '3-4 circles maximum' for readability